KUALA LUMPUR, April 2 (Bernama) — The Xiong’an “Artificial Intelligence+” Industry Ecosystem Integration Development Forum, a parallel event of the 2026 ZGC Forum, brought together more than 400 global artificial intelligence (AI) experts, industry leaders and investors in Xiong’an New Area to explore the next phase of AI-driven growth and Beijing-Xiong’an collaboration.
Held under the theme of “Beijing-Xiong’an Intelligent Innovation and Ecosystem Integration”, the forum outlined Xiong’an’s evolving AI industry landscape and introduced a suite of policy measures aimed at supporting enterprises across the full innovation cycle—from research and development to real-world application deployment.
Key outcomes included the release of collaborative innovation achievements between Beijing and Xiong’an, major application scenarios, and an “Open Competition Mechanism to Select the Best Candidates” list, according to a statement.
Together, these initiatives are designed to accelerate industrial coordination through technology breakthroughs, scenario-based applications and demonstrable results.
Several major projects were also launched, including joint Beijing-Xiong’an science and technology initiatives, investment projects backed by the Xiong’an Fund, new enterprise entries into Xiong’an Zhongguancun Park, and the rollout of key innovation platforms.
In addition, authorities officially introduced the “Hundred Models Competition”, aimed at attracting high-quality AI models and solutions while fostering innovation through competitive selection and talent aggregation.
During keynote sessions, leading academics and researchers highlighted global AI trends, theoretical advancements and China’s research progress, underscoring Xiong’an’s growing role as a hub for intelligent integration and innovation.
As the only host city outside Beijing for a 2026 ZGC Forum parallel event, Xiong’an is accelerating the development of a full AI innovation chain spanning research and development, incubation and industrial clustering.
Looking ahead, the continued integration of Beijing and Xiong’an is expected to strengthen the broader Beijing-Tianjin-Hebei innovation corridor and drive regional economic growth through AI-led transformation.
SINGAPORE, April 2 (Bernama-GLOBE NEWSWIRE) — Vocalbeats.AI, a Singapore-based AI-powered audio company, today announces a partnership with Nanyang Technological University, Singapore (NTU Singapore) to establish the Vocalbeats.AI‑Turing AI Scholarship. The partnership was formalised at a signing ceremony at NTU on April 1.
The scholarship aims to recognise and support exceptional undergraduates enrolled in the College of Computing and Data Science (CCDS) at NTU, reflecting Vocalbeats.AI’s commitment to nurturing world-class talent in Singapore. Recipients of the scholarship will be encouraged to apply for internships, mentorships, and career pathways within the company, as Vocalbeats.AI continues to grow its team in tandem with the expanding global reach of its products and services.
Marco Lai Jinnan, CEO of Vocalbeats.AI, said: “Voice AI is reshaping how people connect across languages and cultures. This scholarship is our commitment to ensuring we have the world-class talent to advance that frontier, and our experience working with NTU students and graduates has shown us what is possible when the brightest young minds take on real-world challenges. We look forward to creating more of those opportunities for students who are ready to build the future of voice AI with us.”
The scholarship comes at a time when demand for AI engineering talent continues to outstrip supply globally. In Singapore, the National AI Strategy 2.0 has set an explicit goal of tripling the nation’s AI practitioner pool, calling directly on industry to co-invest in building that capacity alongside universities, including NTU.
Professor Luke Ong, Dean of NTU’s College of Computing and Data Science and Vice President (AI & Digital Economy), said: “This partnership highlights the importance of industry-university collaboration in developing AI talent. The Turing AI Scholars Programme at NTU combines rigorous training in AI and computing with masterclasses, hands-on research opportunities, and international immersion experiences. With Vocalbeats.AI’s support, our students will have valuable opportunities to engage with industry, apply their skills, and contribute to Singapore’s growing AI ecosystem.”
Vocalbeats.AI has already been contributing to Singapore’s AI talent capacity-building objectives. In 2025, the company strengthened its university partnerships, welcoming students from local universities into its internship programme. One of the graduates from NTU has since transitioned into a full-time role and is currently contributing to the company’s research capabilities.
About Vocalbeats.AI
Vocalbeats.AI is a Singapore-based AI-powered audio company dedicated to innovating intelligent, user-friendly products and services designed to improve everyday life with more lifelike, intuitive, and accessible voice AI. Its expanding portfolio of AI-powered applications — spanning productivity, wellness, and beyond — is increasingly being embraced by a diverse global user base.
Beyond developing applications, Vocalbeats.AI is redefining how people interact with AI. Powered by an international team of engineers, designers and researchers, the Company pushes the boundaries of voice and AI technology to empower people everywhere to work smarter, connect more meaningfully, and live better.
TOBU TOWER SKYTREE Co., Ltd., operator of TOKYO SKYTREE, is holding “BLUE LOCK EPISODE SKY in TOKYO SKYTREE (R),” in the first collaboration between the tower and a popular TV anime featuring soccer, “BLUE LOCK,” written by Muneyuki Kaneshiro and illustrated by Yusuke Nomura. The event will be held from Thursday, April 9, to Monday, July 6, 2026.
The 450-meter-high Tembo Galleria has an exhibition featuring the event’s key visuals. Limited-edition goods that are only available at the event and special cafe menu items are offered on this floor. In addition, an event-exclusive photo shoot service is available to those who want a picture of themselves with “BLUE LOCK” characters. On the 350-meter-high Tembo Deck, exclusive videos are screened on the windows converted into a giant screen of SKYTREE ROUND THEATER. Also taking place during the evening, the exterior of the tower will have special “BLUE LOCK”-themed lighting inspired by various characters from the anime.
Moreover, special admission tickets to observation decks with a novelty card featuring an event-exclusive key visual are available. These limited tickets come with access to Tembo Deck and Tembo Galleria, as well as a novelty card with an illustration exclusive to the event.
TOBU TOWER SKYTREE hopes that those who come to Japan will visit and enjoy TOKYO SKYTREE on the occasion of the event.
About TOKYO SKYTREE The 634-meter-high TOKYO SKYTREE is the world’s tallest free-standing broadcasting tower. It has two observation decks, the Tembo Deck, 350 meters high, and the Tembo Galleria, 450 meters high, commanding a spectacular panoramic view of Tokyo. At night, TOKYO SKYTREE is colorfully lit up in three lighting styles — “Iki,” characterized by a pale blue, “Miyabi,” featuring Edo purple, and the “Nobori” auspicious tangerine hue. Special lighting can be seen during seasonal and other events.
-Overseas Development of Japan-grown Sprouts Rapidly Growing-
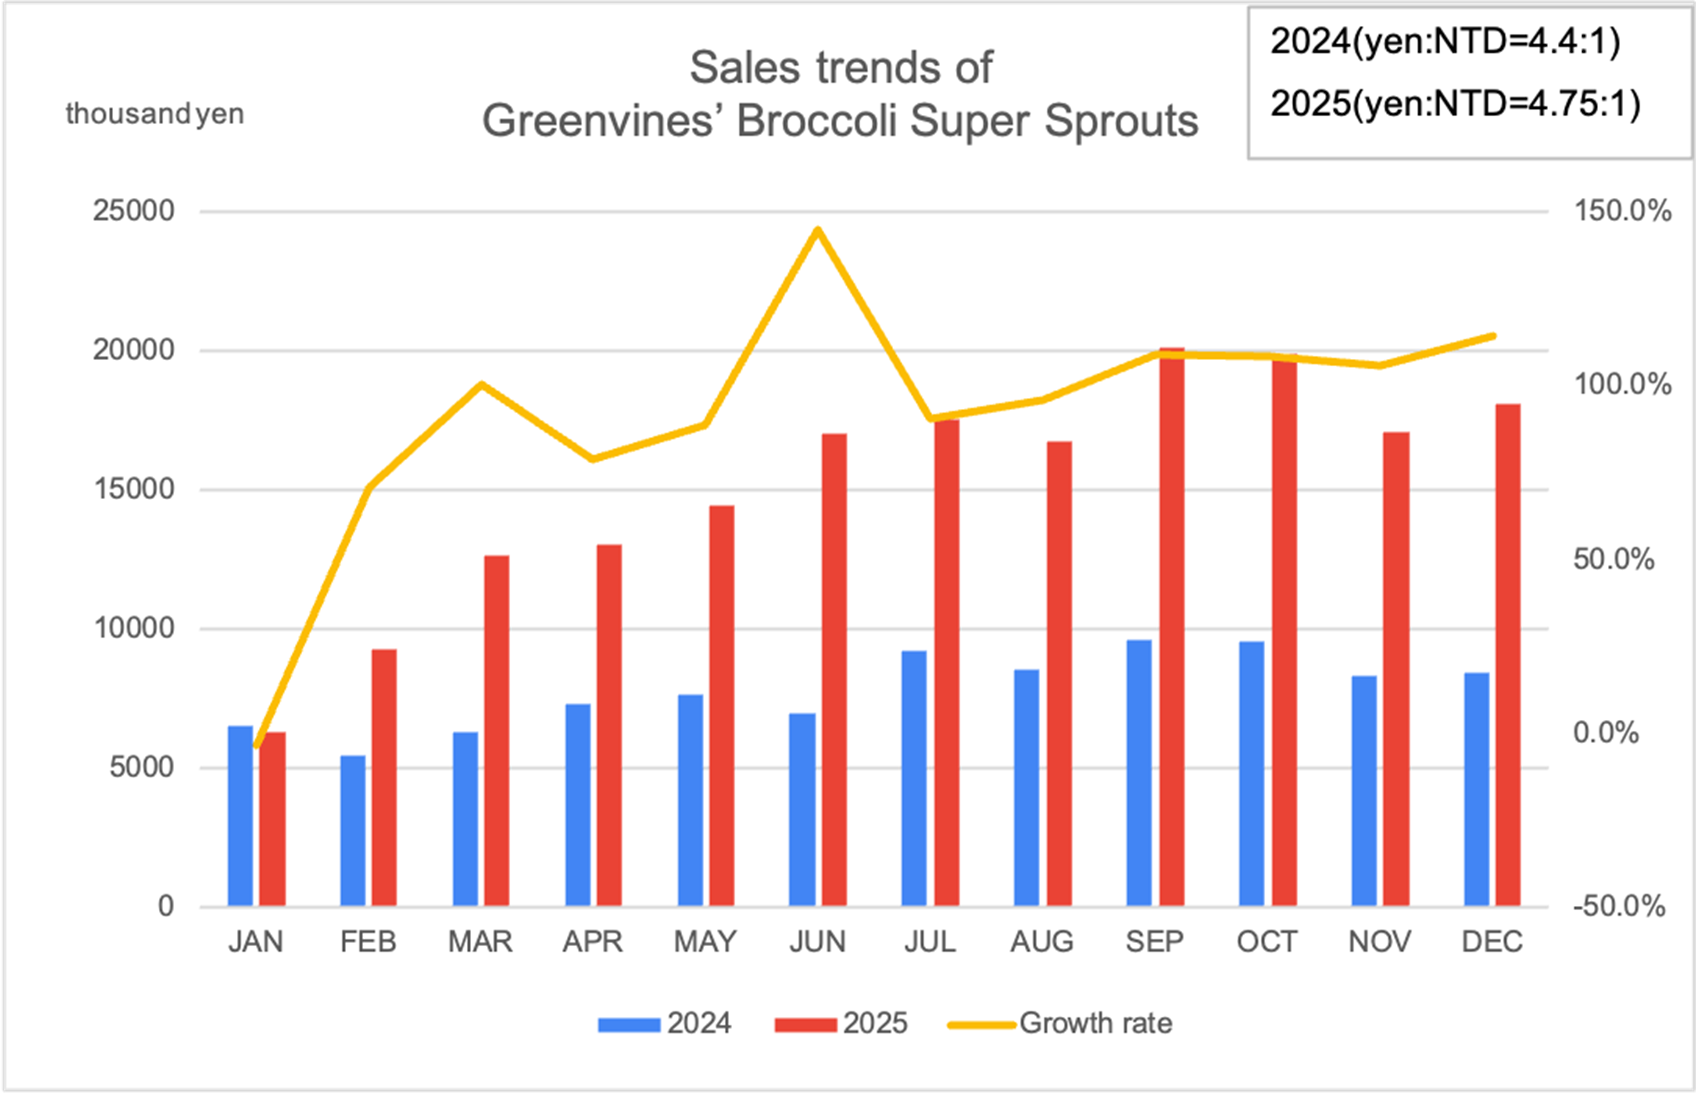
Murakami Farm Co., Ltd., announced on March 30 that the company’s sales of “Broccoli Super Sprouts,” produced by Taiwanese company “Greenvines” under license, recorded a twofold year-on-year increase in FY2025, demonstrating that its first overseas license business is rapidly gaining speed.
Boasting the top market share of sprouts in Japan, Murakami Farm entered into a license agreement for the production and sales of sprout products with Greenvines in the Taiwan region in 2021, with shipments starting in 2022.
Murakami Farm has systematized its know-how in the selection of material seeds, production/quality management, and marketing cultivated over many years in the field of sprout products and has been providing its latest techniques to Greenvines. Behind the growth of the sprout business in the Taiwan region are increasing health awareness and high confidence in the Japanese brand among local people.
In the Taiwan region, the ratio of people eating out has rapidly risen due to the increasing number of double-income households, and inadequate intake of fresh vegetables is seen as a problem. In addition, the population in the Taiwan region is aging as in Japan, and they seem to be becoming more and more health-conscious. Under these circumstances, Broccoli Super Sprouts, containing high concentrations of the beneficial compound “sulforaphane,” is gaining increasing support mainly among highly health-conscious people. In addition, people’s sense of trust in the safety and production/quality management of the product as a licensed Japanese-branded product has supported its growing demand. As in Japan, the amount of sulforaphane contained in the product produced in the Taiwan region is also regularly measured at Murakami Farm’s Sulforaphane Laboratory to check whether the product contains an adequate amount. In this way, the company has realized a system for producing and shipping the products while also checking sulforaphane levels.
This project is one of the initiatives of Murakami Farm’s overseas license business in developing its knowledge and know-how concerning Japan-grown sprouts. In the global market, there is also increasing interest in sprout products focusing on functionality. The company has a future-based policy of further strengthening its business foundation in the Taiwan region and developing overseas license businesses mainly in Asia. By providing the latest plant factory techniques that can produce products of reliable quality throughout the year independent of environmental changes such as climate conditions, it will enhance local people’s health and promote its business growth in the expanding global market.
Q4 EPS more than doubles to $0.14 as profitability improves significantly year over year
IRVINE, Calif., March 30 (Bernama-BUSINESS WIRE) — SBC Medical Group Holdings Incorporated (Nasdaq: SBC) (“SBC Medical” or the “Company”), a Management Services Organization operating a wide range of franchise businesses across diverse medical fields, today announced its financial results for the fourth quarter of fiscal year 2025 (three months ended December 31, 2025) and for the full fiscal year 2025 (twelve months ended December 31, 2025).
Fourth Quarter 2025 Highlights
Total revenues were $40 million, representing an 11% year-over-year decrease.
Net Income attributable to SBC Medical Group was $14 million, representing a 117% year-over-year increase.
Earnings per share, which is defined as net income attributable to the Company divided by the weighted average number of outstanding shares, was $0.14 for the three months ended December 31, 2025, representing 133% year-over-year increase.
EBITDA¹, which is calculated by adding depreciation and amortization expense and impairment loss on intangible assets to income from operations was $14 million, representing a 35% year-over-year decrease. EBITDA margin¹ was 34% for the fourth quarter of 2025, representing a year-over-year decrease of 12 percentage points.
Return on equity, which is defined as net income attributable to the Company divided by the average shareholder’s equity as of December 31, 2025, was 23% representing a year-over-year increase of 9.8 percentage points.
Number of Franchise Locations² was 283 as of December 31, 2025, representing an increase of 34 locations from December 31, 2024.
Number of customers³ in the last twelve months ended December 31, 2025, was 6.6 million, representing a 12% year-over-year increase.
Repeat rate for customers⁴ who visited franchisee’s clinics twice or more was 72%.
¹ EBITDA and EBITDA Margin are non-GAAP financial measures. For more information on non-GAAP financial measures, please see the section “Use of Non-GAAP Financial Measures” and the table captioned “Unaudited Reconciliations of GAAP and Non-GAAP Results.”
² The figures take into accounts of the franchising of SBC brand clinics, Rize Clinic, Gorilla Clinic, AHH, JUN CLINIC
³ The customer count includes customers of SBC brand clinics, Rize Clinic, Gorilla Clinic, AHH Clinic, and JUN CLINIC. The applicable periods are from January 1, 2025, to December 31, 2025.
⁴ The figures include franchising of SBC brand clinics, Rize Clinic, and Gorilla Clinic, but does not take account of customers of AHH clinics and JUN CLINIC excluding free counseling. The percentage of customers who visited our franchisee’s clinics twice or more.
Full Year 2025 Highlights
Total revenues were $174 million, representing a 15% year-over-year decrease.
Net Income attributable to SBC Medical Group was $51 million, representing a 9% year-over-year increase.
Earnings per share, which is defined as net income attributable to the Company divided by the weighted average number of outstanding shares, was $0.50 for the year ended December 31, 2025, representing a 4% year-over-year increase.
EBITDA¹, which is calculated by adding depreciation and amortization expense and impairment loss on intangible assets to income from operations was $70 million, representing a 21% year-over-year decrease. EBITDA margin was 40% for the full year 2025, representing a year-over-year decrease of 3 percentage points.
Yoshiyuki Aikawa, Chairman and Chief Executive Officer of SBC Medical, commented: “Our full-year 2025 results reflect a business in transition. Revenue declined 15% to $174 million, primarily due to two structural changes: the business restructuring undertaken in 2024, and the revision of franchise fee arrangements implemented in April 2025. These were deliberate steps to build a more sustainable business foundation, and their financial impact is now largely behind us.
Beneath the revenue decline, our underlying profitability strengthened considerably. Full-year net income attributable to SBC Medical Group grew 9% to $51 million, with earnings per share of $0.50. Our net income margin expanded from 23% to 29%, as the IPO-related stock-based compensation and impairment losses that weighed on our prior-year results did not recur. EBITDA margin normalized modestly from 43% to 40%, which we view as a more sustainable run-rate going forward.
In the fourth quarter specifically, we saw encouraging operational momentum. Average revenue per customer recovered to $316, an 11% increase year over year — a meaningful inflection after a period of gradual decline, and one that we believe reflects the early impact of our pricing and customer engagement initiatives. We closed the year with 283 clinic locations and 6.63 million annual customer visits.
As we enter 2026, we are focused on three priorities: advancing our multi-brand strategy in the dermatology segment, expanding our non-aesthetic healthcare portfolio, and building a stronger foundation in international markets. With the structural headwinds of the past two years now largely behind us, we are well-positioned to return to sustainable top-line growth.”
Conference Call
The Company will hold a conference call on Friday, March 27, 2026 at 8:30 am Eastern Time (or Friday, March 27, 2026 at 10:30 pm Japan Time) to discuss the financial results and take questions live.
It will automatically direct you to the registration page of “Q4 2025 and Full Year Financial Results”. Please follow the steps to enter your registration details, then click “Submit.”.
Additionally, the earnings release, accompanying slides, and an archived webcast of this conference call will be available at the Company’s Investor Relations website at https://ir.sbc-holdings.com/
About SBC Medical
SBC Medical Group Holdings Incorporated is a Management Services Organization operating a wide range of franchise businesses across diverse medical fields, including advanced aesthetic healthcare, dermatology, orthopedics, fertility treatment, gynecology, dentistry, alopecia treatment (AGA), and ophthalmology. The Company manages a diverse portfolio of clinic brands and is actively expanding its global presence, particularly in the United States and Asia, through both direct operations and medical tourism initiatives. In September 2024, the Company was listed on Nasdaq, and in June 2025, it was selected for inclusion in the Russell 3000® Index, a broad benchmark of the U.S. equity market. Guided by its Group Purpose “Contributing to the well-being of people around the world through medical innovation,” SBC Medical Group Holdings Incorporated continues to provide safe, trusted, and high-quality medical services while further strengthening its international reputation for quality and trust in medical care.
The Company uses non-GAAP measures, such as EBITDA and EBITDA margin, in evaluating its operating results and for financial and operational decision-making purposes. The Company believes that the non-GAAP financial measures help identify underlying trends in its business. The Company believes that the non-GAAP financial measures provide useful information about the Company’s results of operations, enhance the overall understanding of the Company’s past performance and future prospects and allow for greater visibility with respect to key metrics used by the Company’s management in its financial and operational decision-making.
The non-GAAP financial measures are not defined under U.S. GAAP and are not presented in accordance with U.S. GAAP. The non-GAAP financial measures have limitations as analytical tools, and when assessing the Company’s operating performance, cash flows or liquidity, investors should not consider them in isolation, or as a substitute for net loss, cash flows provided by operating activities or other consolidated statements of operations and cash flows data prepared in accordance with U.S. GAAP.
The Company mitigates these limitations by reconciling the non-GAAP financial measures to the most comparable U.S. GAAP performance measures, all of which should be considered when evaluating the Company’s performance.
For more information on the non-GAAP financial measures, please see the table captioned “Unaudited Reconciliations of GAAP and Non-GAAP Results.”
Forward-Looking Statements
This press release contains forward-looking statements. Forward-looking statements are not historical facts or statements of current conditions, but instead represent only the Company’s beliefs regarding future events and performance, many of which, by their nature, are inherently uncertain and outside of the Company’s control. These forward-looking statements reflect the Company’s current views with respect to, among other things, the Company’s financial performance; growth in revenue and earnings; business prospects and opportunities; and capital deployment plans and liquidity. In some cases, forward-looking statements can be identified by the use of words such as “may,” “should,” “expects,” “anticipates,” “contemplates,” “estimates,” “believes,” “plans,” “projected,” “predicts,” “potential,” or “hopes” or the negative of these or similar terms. The Company cautions readers not to place undue reliance upon any forward-looking statements, which are current only as of the date of this release and are subject to various risks, uncertainties, assumptions, or changes in circumstances that are difficult to predict or quantify. The forward-looking statements are based on management’s current expectations and are not guarantees of future performance. The Company does not undertake or accept any obligation to release publicly any updates or revisions to any forward-looking statements to reflect any change in its expectations or any change in events, conditions, or circumstances on which any such statement is based, except as required by law. Factors that may cause actual results to differ materially from current expectations may emerge from time to time, and it is not possible for the Company to predict all of them; such factors include, among other things, changes in global, regional, or local economic, business, competitive, market and regulatory conditions, and those listed under the heading “Risk Factors” and elsewhere in the Company’s filings with the U.S. Securities and Exchange Commission (the “SEC”), which are accessible on the SEC’s website at www.sec.gov.
SBC MEDICAL GROUP HOLDINGS INCORPORATED
CONSOLIDATED BALANCE SHEETS
December 31, 2025
December 31, 2024
ASSETS
Current assets:
Cash and cash equivalents
$
163,773,838
$
125,044,092
Accounts receivable
2,388,021
1,413,433
Accounts receivable – related parties
27,511,730
28,846,680
Inventories
2,792,617
1,494,891
Short-term investments – related parties
319,193
—
Finance lease receivables, current – related parties
12,832,355
5,992,585
Income tax recoverable
1,175,510
—
Customer loans receivable, current
8,705,999
10,382,537
Prepaid expenses and other current assets
11,724,852
11,276,802
Total current assets
231,224,115
184,451,020
Non-current assets:
Property and equipment, net
7,539,392
8,771,902
Intangible assets, net
47,742,888
1,590,052
Long-term investments, net
1,299,366
3,049,972
Equity method investments
20,312,642
—
Goodwill, net
15,432,061
4,613,784
Finance lease receivables, non-current – related parties
13,746,513
8,397,582
Operating lease right-of-use assets
8,366,569
5,267,056
Finance lease right-of-use assets
450,874
—
Deferred tax assets
4,014,294
9,798,071
Customer loans receivable, non-current
4,824,977
5,023,551
Long-term prepayments
393,270
1,745,801
Long-term investments in MCs – related parties
17,837,293
17,820,910
Other assets
7,263,692
15,553,453
Total non-current assets
149,223,831
81,632,134
Total assets
$
380,447,946
$
266,083,154
LIABILITIES AND STOCKHOLDERS’ EQUITY
Current liabilities:
Accounts payable
$
16,988,384
$
13,875,179
Accounts payable – related parties
651,463
659,044
Bank and other borrowings, current
9,099,046
96,824
Notes payables, current – related parties
—
26,255
Advances from customers
1,415,762
820,898
Advances from customers – related parties
5,357,221
11,739,533
Income tax payable
8,821,853
18,705,851
Operating lease liabilities, current
4,416,960
4,341,522
Finance lease liabilities, current
132,946
—
Accrued liabilities and other current liabilities
11,544,695
8,103,194
Due to related party
2,692,673
2,823,590
Total current liabilities
61,121,003
61,191,890
Non-current liabilities:
Bank and other borrowings, non-current
33,734,438
6,502,682
Notes payables, non-current – related parties
—
5,334
Deferred tax liabilities
16,374,832
926,023
Operating lease liabilities, non-current
4,136,257
1,241,526
Finance lease liabilities, non-current
116,527
—
Other liabilities
1,660,183
1,193,541
Total non-current liabilities
56,022,237
9,869,106
Total liabilities
117,143,240
71,060,996
Stockholders’ equity:
Preferred stock ($0.0001 par value, 20,000,000 shares authorized; no shares issued and outstanding as of December 31, 2025 and 2024)
—
—
Common stock ($0.0001 par value, 400,000,000 shares authorized, 103,881,251 and 103,020,816 shares issued, 102,576,943 and 102,750,816 shares outstanding as of December 31, 2025 and 2024, respectively)
10,388
10,302
Additional paid-in capital
72,867,424
62,513,923
Treasury stock (at cost, 1,304,308 and 270,000 shares as of December 31, 2025 and December 31, 2024, respectively)
(7,749,997
)
(2,700,000
)
Retained earnings
240,448,620
189,463,007
Accumulated other comprehensive loss
(57,294,239
)
(54,178,075
)
Total SBC Medical Group Holdings Incorporated stockholders’ equity
248,282,196
195,109,157
Non-controlling interests
15,022,510
(86,999
)
Total stockholders’ equity
263,304,706
195,022,158
Total liabilities and stockholders’ equity
$
380,447,946
$
266,083,154
SBC MEDICAL GROUP HOLDINGS INCORPORATED
CONSOLIDATED STATEMENTS OF OPERATIONS AND COMPREHENSIVE INCOME
For the Three Months Ended December 31, (Unaudited)
For the Years Ended December 31,
2025
2024
2025
2024
Revenues, net – related parties
$
35,041,379
$
42,455,401
$
158,860,970
$
195,173,889
Revenues, net
4,525,327
1,965,136
14,746,519
10,241,653
Total revenues, net
39,566,706
44,420,537
173,607,489
205,415,542
Cost of revenues
10,638,132
10,548,170
46,323,767
49,365,035
Gross profit
28,928,574
33,872,367
127,283,722
156,050,507
Operating expenses:
Selling, general and administrative expenses
16,079,682
13,880,503
59,797,324
57,665,140
Stock-based compensation
—
215,237
—
13,022,692
Impairment loss on intangible asset
―
15,058,965
—
15,058,965
Total operating expenses
16,079,682
29,154,705
59,797,324
85,746,797
Income from operations
12,848,892
4,717,662
67,486,398
70,303,710
Other income (expenses):
Interest income
(284
)
(17,340
)
198,315
19,943
Interest expense
(56,090
)
(12,402
)
(160,583)
(28,300
)
Foreign currency exchange gain, net
2,907,364
800,643
2,002,789
895,711
Other income
3,184,379
3,287,471
5,113,637
3,914,297
Other expenses
(317,263
)
(2,716,703
)
(1,321,064
)
(5,463,153
)
Gain on redemption of life insurance policies
—
—
8,746,138
—
Gain on disposal of subsidiary
—
—
—
3,813,609
Total other income
5,718,106
1,341,669
14,579,232
3,152,107
Income before income taxes
18,566,998
6,059,331
82,065,630
73,455,817
Income tax expense (benefit)
4,287,103
(488,553
)
31,020,607
26,765,925
Net income
14,279,895
6,547,884
51,045,023
46,689,892
Less: net income attributable to non-controlling interests
79,604
8,663
59,410
75,617
Net income attributable to SBC Medical Group Holdings Incorporated
$
14,200,291
$
6,539,221
$
50,985,613
$
46,614,275
Other comprehensive loss:
Foreign currency translation adjustment
$
(14,589,478
)
$
(18,100,852)
$
(2,949,843)
$
(16,557,607)
Total comprehensive income (loss)
(309,583)
(11,552,968)
48,095,180
30,132,285
Less: comprehensive income attributable to non-controlling interests
67,823
7,737
225,731
117,830
Comprehensive income (loss) attributable to SBC Medical Group Holdings Incorporated
$
(377,406)
$
(11,560,705)
$
47,869,449
$
30,014,455
Net income per share attributable to SBC Medical Group Holdings Incorporated
Basic and diluted
$
0.14
$
0.06
$
0.50
$
0.48
Weighted average shares outstanding
Basic and diluted
102,576,943
102,750,816
102,997,967
96,561,041
SBC MEDICAL GROUP HOLDINGS INCORPORATED
CONSOLIDATED STATEMENTS OF CASH FLOWS
For the Years Ended December 31,
2025
2024
CASH FLOWS FROM OPERATING ACTIVITIES
Net income
$
51,045,023
$
46,689,892
Adjustments to reconcile net income to net cash provided by operating activities:
Depreciation and amortization expense
2,684,300
3,799,377
Non-cash lease expense
4,698,731
3,870,198
Provision for (reversal of) credit losses
302,949
(402,196
)
Stock-based compensation
―
13,022,692
Impairment loss on intangible asset
―
15,058,965
Impairment loss on long-term investments
133,513
529,596
Fair value change of long-term investments
(247,514
)
2,617,435
Gain on disposal of subsidiary
―
(3,813,609
)
Gain on redemption of life insurance policies
(8,746,138
)
—
Loss (gain) on disposal of property and equipment and intangible assets
(3,179,200
)
511,947
Gain on previously held equity interest
(815,328
)
—
Deferred income taxes
5,326,982
(14,417,087
)
Changes in operating assets and liabilities:
Accounts receivable
(160,963
)
(733,219
)
Accounts receivable – related parties
1,552,477
1,350,413
Inventories
(170,174
)
1,124,805
Finance lease receivables – related parties
(12,746,857
)
(5,991,486
)
Customer loans receivable
15,821,375
18,477,327
Prepaid expenses and other current assets
332,264
(2,268,209
)
Long-term prepayments
318,470
1,910,274
Other assets
(195,846
)
(1,692,642
)
Accounts payable
2,675,066
(9,588,067
)
Accounts payable – related parties
(8,571
)
682,320
Notes payables – related parties
(14,252,502
)
(34,756,754
)
Advances from customers
604,072
(1,476,240
)
Advances from customers – related parties
(6,693,127
)
(9,144,031
)
Income tax payable
(11,662,531
)
11,228,429
Operating lease liabilities
(4,927,460
)
(3,950,587
)
Accrued liabilities and other current liabilities
2,968,513
(12,096,825
)
Other liabilities
10,972
40,215
NET CASH PROVIDED BY OPERATING ACTIVITIES
24,668,496
20,582,933
CASH FLOWS FROM INVESTING ACTIVITIES
Purchase of property and equipment
(1,401,012
)
(2,564,643
)
Purchase of convertible note
—
(1,700,000
)
Prepayments for property and equipment
(968,848
)
(843,740
)
Advances to related parties
—
(622,804
)
Payments made on behalf of related parties
(1,840,801
)
(5,572,564
)
Purchase of short-term investments – related parties
(334,173
)
—
Purchase of long-term investments
(654,070
)
(331,496
)
Purchases of cryptocurrencies
(424,250
)
—
Proceeds from disposal of cryptocurrencies
457,828
—
Purchase of equity method investments
(20,062,642
)
—
Cash paid for acquisition of subsidiaries, net of cash acquired
(22,941,701
)
(4,236,009
)
Long-term loans to others
(14,514
)
(172,411
)
Repayments from related parties
1,914,454
6,597,564
Repayment from others
83,677
176,109
Proceeds from redemption of life insurance policies
17,735,717
—
Disposal of subsidiaries, net of cash disposed of
—
(832,416
)
Proceeds from disposal of property and equipment
7,478,783
—
NET CASH PROVIDED USED IN INVESTING ACTIVITIES
(20,971,552
)
(10,102,410
)
CASH FLOWS FROM FINANCING ACTIVITIES
Borrowings from bank and others
34,753,946
6,603,253
Borrowings from related parties
15,000
5,481,787
Proceeds from reverse recapitalization, net of transaction costs
—
11,707,417
Proceeds from exercise of stock warrants
—
31,374
Repayments of bank and other borrowings
(1,353,071
)
(119,017
)
Repayments of finance lease liabilities
(331,365
)
—
Repayments to related parties
(145,917
)
(739,414
)
Repurchase of common stock
(4,999,997
)
—
Deemed contribution in connection with price modification on disposal of property and equipment
10,353,587
—
NET CASH PROVIDED BY FINANCING ACTIVITIES
38,292,183
22,965,400
Effect of exchange rate changes
(3,259,381
)
(11,424,763
)
NET CHANGE IN CASH AND CASH EQUIVALENTS
38,729,746
22,021,160
CASH AND CASH EQUIVALENTS AS OF THE BEGINNING OF THE YEAR
125,044,092
103,022,932
CASH AND CASH EQUIVALENTS AS OF THE END OF THE YEAR
$
163,773,838
$
125,044,092
SUPPLEMENTAL DISCLOSURE OF CASH FLOW INFORMATION
Cash paid for interest expense
$
160,583
$
28,300
Cash paid for income taxes
$
37,190,188
$
30,239,002
NON-CASH INVESTING AND FINANCING ACTIVITIES
Property and equipment transferred from long-term prepayments
$
1,493,450
$
597,602
Operating lease right-of-use assets obtained in exchange for operating lease liabilities
$
1,322,455
$
—
Finance lease right-of-use assets obtained in exchange for finance lease liabilities
$
612,466
$
—
Remeasurement of operating lease liabilities and right-of-use assets due to lease modifications
$
5,302,043
$
2,908,554
Payables to related parties in connection with loan services provided
$
14,219,401
$
20,524,499
Issuance of common stock as incentive shares
$
86
$
—
Issuance of common stock from conversion of convertible note
$
—
$
2,700,000
Deemed contribution in connection with disposal of subsidiaries
$
—
$
1,473,571
RECONCILIATION OF GAAP TO NON-GAAP FINANCIAL MEASURES
SBC MEDICAL GROUP HOLDINGS INCORPORATED
Unaudited Reconciliations of GAAP and Non-GAAP Results